News
 
Gravatar
Pin on Pinterest

RNA sequencing, also known as RNA-Seq, is an exceptionally potent and all-encompassing approach to examining the transcriptome of cells. The process of RNA-Seq revolves around constructing a library of complementary DNA (cDNA) for sequencing. To begin library construction, cellular RNA is first isolated, followed by quality control assessments to ascertain RNA integrity. Afterward, the RNA of interest in the library can be enriched through removal or screening techniques, and subsequently, it undergoes reverse transcription into cDNA prior to sequencing.

RNA-Seq finds extensive applications, ranging from fundamental explorations of cellular structure and function to the identification and analysis of various disease conditions in clinical samples. This technology enables both qualitative and quantitative detection of numerous RNAs in biological samples at specific time points. For instance, alterations in gene expression before and after a therapeutic intervention can be compared to determine the presence or absence of a disease. Moreover, RNA-Seq can identify selective splicing patterns, post-transcriptional modifications, and exon-intron boundaries. The acquired data holds invaluable insights into underlying cellular mechanisms, genome structure, disease-causing effects, and much more.


Total RNA Sequencing

Total RNA-Seq, also known as whole transcriptome sequencing, is a comprehensive method that encompasses the sequencing of all RNA molecules, both coding and non-coding. In this approach, RNA is sequenced after the removal of ribosomal RNA (rRNA), resulting in a diverse collection of RNA molecules. The initial isolation of total RNA yields a mixture of various RNAs, such as rRNAs, precursor messenger RNAs (pre-mRNAs), messenger RNAs (mRNAs), and different types of non-coding RNAs (ncRNAs), including transfer RNAs (tRNAs), microRNAs (miRNAs), and long fragments of non-coding RNAs (lncRNAs) that are not translated into proteins (transcripts longer than 200 nucleotides).

Different RNA subtypes.

Different RNA subtypes. (Cui et al., 2022)

Total RNA-Seq offers insights into both coding RNAs and non-coding RNAs (e.g., lncRNAs and miRNAs), providing valuable information about regulatory regions, overall transcript expression levels, splicing patterns, and the identification of exons, introns, and their boundaries.

During sequencing, many lncRNA reads may overlap with mRNAs. It is noteworthy that approximately 20% of genes in the human genome are transcribed from opposite strands, leading to overlapping regions. Consequently, strand-specific total RNA sequencing methods are necessary to distinguish between these strands. Strand-specific sequencing techniques enable the identification of the specific DNA strand (coding or template strand) that generates the RNA transcript. Furthermore, they enhance the accuracy of gene expression data by improving the annotation of sequencing reads and facilitating the addition of matchable sequencing reads.

To enhance the sensitivity of sequencing, rRNA, which constitutes 80-90% of total RNA, is typically removed through debiasing. Eliminating rRNA transcripts allows for a greater concentration of sequencing reads on the desired transcripts, thereby increasing the sensitivity of the sequencing process. The removal of rRNA is particularly crucial when the expression level of the target transcript is low.


mRNA Sequencing

mRNA-Seq is the preferred choice when focusing on the coding region of eukaryotic targets. This method employs a screening technique to enrich for poly(adenylated) (poly(A)) RNAs. Since mRNAs constitute only a small fraction of the total RNA, sequencing only the mRNAs proves to be the most efficient and cost-effective approach if it aligns with the experimental objective.

In contrast to the rRNA removal step in total RNA-Seq, mRNA-Seq relies on Poly(A) affinity screening to enrich for mRNA. Both methods effectively eliminate rRNA from samples. The decision between rRNA removal and Poly(A) enrichment depends on various factors, including sample size and type (e.g., prokaryotes, animals, and plants), with each requiring different methods.

Sample enrichment or removal methods, such as ribosome removal or mRNA enrichment, enhance the quality of sequencing data in both Total RNA-Seq and mRNA-Seq workflows. These approaches enable sequencing of target RNA molecules while minimizing the waste of sequencing reads.

It is crucial to identify the desired information from the RNA-Seq data, as this helps exclude other types of RNAs from the sequencing process. If the focus is on the coding region, mRNA-Seq is the appropriate choice. Concentrating on mRNAs provides superior gene expression data since they constitute only 3-7% of the mammalian transcriptome. Compared to total RNA-Seq, mRNA-Seq allows for library preparation using smaller sample sizes while increasing sequencing depth.

mRNA-seq flowchart and data analysis pipeline.

mRNA-seq flowchart and data analysis pipeline. (Zhao et al. 2016)

Budget considerations are also important in selecting the appropriate method. Total RNA-Seq requires more sequencing data (typically 100-200 million sequencing reads per sample) and incurs higher costs compared to mRNA-Seq. If only mRNA information is required, mRNA-Seq offers greater sequencing depth and lower costs than total RNA-Seq. This is because sequencing reads (typically 25-50 million sequencing reads per sample) are concentrated on Poly(A)-enriched RNA molecules. For samples with limited starting material, mRNA-Seq is the most suitable method, providing better sequencing read data, lower costs, and requiring less starting material.

How to Choose mRNA Sequencing and Total RNA Sequencing

Choosing between total RNA-Seq and mRNA-Seq techniques requires careful consideration of the overall experimental objective, potential biological issues, and technical limitations. Each method offers unique advantages and disadvantages. Total RNA-Seq provides the most comprehensive transcriptome analysis by capturing all RNA species present in the sample, including non-coding RNAs and alternative splicing variants. On the other hand, mRNA-Seq focuses specifically on protein-coding transcripts, providing superior data on the coding regions of genes.

In addition to the experimental objective, several other factors should be taken into account. The sample type plays a crucial role in selecting the appropriate method. For samples with limited starting material, such as small tissue samples or single cells, mRNA-Seq is often preferred due to its higher sensitivity and ability to work with low input amounts. Total RNA-Seq, however, is more versatile and can handle a broader range of sample types, including degraded or partially fragmented RNA.

The sample starting volume should also be considered. If the available starting material is limited, mRNA-Seq may be a more viable option. Conversely, if a larger volume of starting material is available, total RNA-Seq can be performed more efficiently.

Project budget is another important factor. mRNA-Seq is generally more cost-effective since it focuses on a smaller portion of the transcriptome, whereas total RNA-Seq covers the entire transcriptome and may require a larger budget.

Furthermore, it is crucial to evaluate the technical limitations and requirements of each method. mRNA-Seq involves additional steps for mRNA enrichment, which can introduce biases. On the other hand, total RNA-Seq captures the entire RNA population but may have lower specificity for mRNA. Consider the available expertise and resources in laboratory for performing the chosen method.

By considering the experimental objective, potential biological issues, technical limitations, sample type, sample starting volume, and project budget, you can make an informed decision on whether to use total RNA-Seq or mRNA-Seq for your specific research needs. It is also advisable to seek advice from experts or bioinformatics professionals to ensure the most appropriate method is chosen.

References:

  1. Cui, Lian, et al. "RNA modifications: importance in immune cell biology and related diseases." Signal transduction and targeted therapy 7.1 (2022): 334.
  2. Zhao, Shanrong, et al. "Bioinformatics for RNA-seq data analysis." Bioinformatics—Updated Features and Applications: InTech (2016): 125-49.
Gravatar
Pin on Pinterest

In microbiome research (including metagenomics and 16S rRNA sequencing), the terms absolute abundance and relative abundance are frequently encountered. However, what exactly do these terms mean, and why is it important to differentiate between them?


What is Relative Abundance?

Relative abundance refers to the proportion of a specific microorganism within the entire microbial community. In other words, it does not provide the actual number of microorganisms but rather indicates the proportion of that microorganism relative to the total microbial count. The sum of relative abundances typically equals 100% (or 1).

Example:

Assume that in a sample, a total of 300,000 bacteria are detected, with 100,000 being species A and 200,000 being species B. The relative abundance can be calculated as follows:

  • Relative abundance of species A = 100,000 / 300,000 = 33.33%
  • Relative abundance of species B = 200,000 / 300,000 = 66.67%

Relative abundance is relatively straightforward to calculate, and since it is normalized to the total microbial count, it is unaffected by the total sample size. High-throughput sequencing techniques, such as 16S rRNA sequencing, are commonly used to obtain relative abundance data.


What is Absolute Abundance?

Absolute abundance refers to the actual number of a specific microorganism present in a sample. It is typically quantified as the "number of microbial cells per gram/milliliter of sample." This measure directly informs us about the actual quantity of microorganisms in the sample.

Example:

In a water sample, suppose 100,000 bacteria of species A and 200,000 bacteria of species B are detected. The absolute abundance of species A is 100,000 cells, and for species B, it is 200,000 cells.

Absolute abundance data is usually obtained through quantitative techniques such as quantitative PCR (qPCR), which require additional experimental steps and precise measurement tools.


Key Differences Between Absolute and Relative Abundance

The main differences between absolute and relative abundance are as follows:

  • Absolute abundance provides the actual count of microorganisms, which reflects the true number of microbes in the sample.
  • Relative abundance describes the proportional relationship between different microorganisms within a sample, allowing for comparison of their relative distributions.

However, a limitation of relative abundance is that it may not accurately reflect the true changes in a microorganism's abundance when the total sample size varies. For instance, if the numbers of both species A and species B decrease proportionally, the relative abundance might remain unchanged, even though the actual number of these microorganisms has decreased. In contrast, absolute abundance would reveal the actual decrease in microbial numbers.

Comparison of absolute and relative abundance metrics.

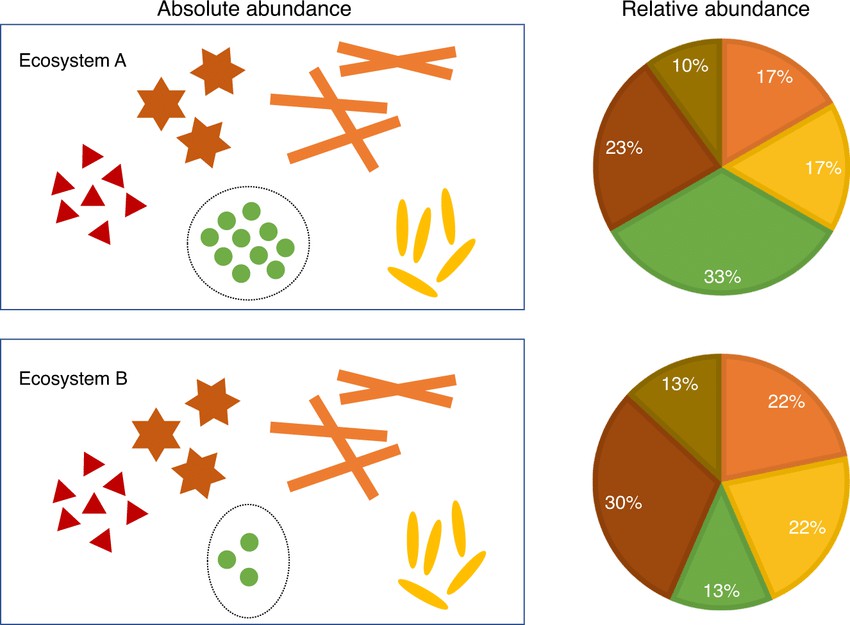
Figure 1. The distinction between absolute abundances and relative abundances (Huang Lin et al., 2020)


When to Use Absolute Abundance and When to Use Relative Abundance?

Absolute abundance: If the goal is to determine the actual number of microorganisms (such as in disease monitoring or precise quantification of microbial load), absolute abundance is more reliable.

Relative abundance: If the focus is on understanding the community structure and comparing the proportions of different microorganisms within a sample (such as in ecological studies of microbial populations), relative abundance is often preferred. This approach highlights the proportional relationships among microbes within the community.

By understanding these two different approaches, researchers can select the appropriate method for their specific study objectives, ensuring that the data obtained provides meaningful and accurate insights into the microbiome.


Absolute and Relative Abundance in 16S rRNA Sequencing

16S rRNA sequencing is a widely employed technique for analyzing microbial community structure. It works by amplifying the 16S rRNA gene of bacteria and archaea, which helps identify the types of microorganisms present in a sample.

In 16S sequencing, relative abundance is commonly used. This is because the sequencing results typically provide the sequence reads for each bacterial taxon (e.g., operational taxonomic units (OTUs) or amplicon sequence variants (ASVs)), rather than the actual quantity of organisms. Variations in sequencing depth and efficiency can influence the total number of sequences across different samples, prompting the conversion of sequence counts into relative abundance for comparison between samples.

Absolute Abundance in 16S Sequencing

To determine absolute abundance in 16S rRNA sequencing, additional methods, such as qPCR or flow cytometry, are required to quantify the total microbial load in the sample. The absolute abundance of each microbial species can then be calculated by multiplying the relative abundance by the total microbial quantity.

Example:

If qPCR reveals that the total bacterial count in a sample is 1 million, and the relative abundance of species A is 20%, the absolute abundance of species A would be:

Formula for calculating microbial absolute abundance.

Figure 2. The formula for calculating absolute abundance

Summary

In 16S sequencing, relative abundance is the primary method of analysis because it eliminates the variability caused by differences in sequencing depth. If absolute abundance is required, quantitative techniques must be incorporated to supplement the data.


Absolute and Relative Abundance in Metagenomic Sequencing

Metagenomic sequencing involves directly sequencing the genomes of all microorganisms present in a sample, providing a more comprehensive analysis. This method allows for the detection of bacteria, fungi, viruses, and other microbial genetic information. Metagenomic sequencing offers higher resolution and enables direct insights into microbial functional characteristics.

Similar to 16S rRNA sequencing, metagenomic sequencing typically utilizes relative abundance for data analysis. This is due to the fact that the total number of sequence reads in metagenomic sequencing can be influenced by sequencing depth, leading to significant variation in the total read count between samples. Therefore, the use of relative abundance ensures comparability across samples.

Absolute Abundance in Metagenomics

To determine the absolute abundance of each microbial species in metagenomic sequencing, total microbial abundance data for the sample is required. As with 16S rRNA sequencing, methods such as qPCR or other quantitative techniques can be employed to estimate total microbial load. The absolute abundance for each microorganism can then be calculated by multiplying the relative abundance by the estimated total abundance.


Metagenomics vs. 16S rRNA Sequencing: Abundance Metrics

16S rRNA Sequencing: This method is more suitable for quickly assessing the composition and changes in microbial communities, especially when budget constraints exist. The calculation of relative abundance is straightforward; however, the resolution is limited due to the sequencing of only a specific fragment of the 16S gene, making it challenging to obtain accurate absolute counts.

Metagenomic Sequencing: This approach captures a broader range of microbial taxa, including bacteria, viruses, fungi, and other organisms, while also providing more in-depth analysis of microbial functional traits. Although metagenomic sequencing is more costly, it offers richer information, including gene functions and ecological roles. Like 16S rRNA sequencing, metagenomic sequencing primarily relies on relative abundance analysis unless supplemented with quantitative techniques to derive absolute abundance.


Advantages of CD Genomics' Amplicon Absolute Quantification Sequencing Technology

Comprehensive Data Acquisition: The technology enables the simultaneous generation of three distinct datasets from a single test, thereby providing a richer and more detailed result.

Minimized Sample Requirements: The method requires a lower sample volume, reducing the risk of data loss due to insufficient sample availability or the absence of backups.

High Throughput and Sensitivity: The technology offers high throughput, with the ability to achieve absolute quantification for a wide range of microbial species within the detection range, ensuring comprehensive analysis.

Complementary Relative and Absolute Quantification: The combination of relative and absolute quantification provides a robust validation of results, reducing the occurrence of false positives commonly associated with traditional relative quantification methods.

Elimination of Cross-Platform qPCR Systematic Errors: The approach mitigates systematic biases often encountered in cross-platform qPCR quantification, ensuring more reliable results.

Superior Specificity and Sensitivity: The internal standard method offers higher specificity, sensitivity, and reproducibility in quantification compared to conventional qPCR techniques.

Minimized PCR Inhibition: The method reduces the impact of residual PCR inhibitors from DNA extraction processes, ensuring the accuracy and reliability of the results.

Simplified Primer Design and Optimization: The approach avoids the challenges typically encountered in primer design and optimization that are inherent to qPCR and other quantitative assays.


Summary

Absolute and relative abundance are two essential concepts in microbiome research. Absolute abundance provides the actual count of microorganisms in a sample, while relative abundance describes the proportional representation of each microorganism within the sample.

In the context of 16S rRNA and metagenomic sequencing, both types of abundance have specific applications:

  • 16S rRNA Sequencing: Relative abundance is primarily used for community structure analysis. If absolute abundance is needed, it must be determined through supplementary techniques, such as qPCR, to quantify the total microbial load.
  • Metagenomic Sequencing: While relative abundance is used to gain a comprehensive understanding of microbial communities and their functions, absolute abundance requires quantitative methods to estimate total microbial abundance.

This article aims to clarify the abundance-related concepts in these sequencing technologies and provide guidance on how to apply both absolute and relative abundance effectively in microbiome studies.

Gravatar

Introduction of Principal Co-ordinates Analysis

Principal Co-ordinates Analysis.Principal co-ordinates analysis, or PCoA, is a visualization method to study the similarity or difference of data. Compared to the principal component analysis (PCA), the main difference is that PCA is based on Euclidean distance, and PCoA is based on distances other than Euclidean distance, and finds the potential principal components of the overall difference through dimensionality reduction. In short, PCoA analysis is a non-binding data dimensionality reduction analysis method that can be used to study the similarity or difference of sample composition and observe the differences between individuals or groups.

Learn other:single cell atac sequencing

Principal Co-ordinates Analysis Method

Commonly used PCoA software includes PCoA diagram and PCoA analysis package in R language. The PCoA mapping is mainly divided into three steps. A specific similarity distance (such as Bray-curits, Unifrac) is first selected and the distance matrix calculated. PCoA (can be done with pcoa command) is then performed, followed by the PCoA graphics (can be displayed with ordiplot command or ggplot).

Principal coordinates analysis (PCoA) of bacterial community structure.

Fig 1. Principal coordinates analysis (PCoA) of bacterial community structure. (Morrissey EM, et al. 2017)

Different shapes or colors in the PCoA diagram represent sample groups under different environments or conditions. The scales of the horizontal and vertical axes are relative distances and have no practical meaning. Among them, PCoA Axis 1 represents the principal coordinate that explains the largest data change, and PCoA Axis 2 represents the principal coordinate that accounts for the largest proportion of the remaining data changes. The spatial distance of sample points represents the distance between samples.

Application Field

Microbial diversity analysis.

Specific OTU (Optical Transform Unit) analysis.

During microbial community structure research, such as 16S and metagenomic sequencing analysis, PCoA sequencing methods are often used to understand the similarities and differences in microbial evolution. A biological information service provider, CD Genomics can provide the PCoA services. We can set different distance algorithms according to your needs and provide analysis report. If you have any questions or analysis needs, please feel free to contact us.

Reference

  1. Morrissey EM, et al. Bacterial carbon use plasticity, phylogenetic diversity and the priming of soil organic matter. ISME J. 2017;11(8):1890-1899.
Gravatar

Introduction of Evolutionary Analysis

Evolutionary analysis can reveal the genetic sequence relationship of classification in the evolution process from the perspective of molecular evolution. In the process of biological information analysis, phylogenetic trees are often used to present the analysis results. The phylogenetic tree can reveal the biological evolution process and mechanism of related species or genes. The evolutionary tree is mainly constructed based on the gene sequence to compare and analyze the changes and differences of genes in different environments, specific species or functions at the level of molecular evolution.

Learn other: 16s rrna sequencing

Evolutionary Analysis Method

Building a phylogenetic tree generally includes the following steps: multiple sequence alignment, choose a method to construct a phylogenetic tree, build evolutionary tree, evaluate evolutionary tree, and lastly beautify the evolutionary tree.

Phylogenetic tree construction pipeline. - CD Genomics.

Fig 1. Phylogenetic tree construction pipeline

The first step of phylogenetic tree construction is to perform multiple sequence alignment. Commonly used software includes MEGA, cluster X, Muscle, phylip, etc.

Methods of phylogenetic tree construction generally include distance-based and character-based methods.

Bootstrap is usually used for evolutionary tree evaluation and testing.

Commonly used evolutionary tree beautification software includes AI, PS, ggtree, GraPhlAn, treeview, Figtree, and online website ITOL.

Phylogenetic tree of 199 B. rapa and 119 B. oleracea accessions. The tree was constructed using 6,707 SNP loci selected from gene pairs that were syntenic in the B. rapa and B. oleracea genomes.

Fig 2. Phylogenetic tree of 199 B. rapa and 119 B. oleracea accessions. The tree was constructed using 6,707 SNP loci selected from gene pairs that were syntenic in the B. rapa and B. oleracea genomes. (Cheng F, et al. 2016)

Application Field

Human, animal and plant evolution analysis.

The evolutionary relationship of a gene or gene family in different species.

During genetic evolution research, the biological evolution process of species or genes can often be displayed intuitively by constructing evolutionary trees. Using various biological information analysis software and tools, a phylogenetic tree can be easily constructed. However, constructing a phylogenetic tree accurately and intuitively requires certain biological information analysis skills. CD Genomics' professional biological information analysis team, with excellent analysis and mapping skills, can provide phylogenetic tree construction services at any time. If you have any questions, please feel free to contact us.

Reference

  1. Cheng F, et al. Subgenome parallel selection is associated with morphotype diversification and convergent crop domestication in Brassica rapa and Brassica oleracea. Nat Genet. 2016;48(10):1218-1224. doi:10.1038/ng.3634
Gravatar
Pin on Pinterest

Overview

Bioluminescence is a particularly interesting phenomenon, and its origin and evolution have long fascinated biologists. Fireflies (Lampyridae) are one of the best-known luminescent organisms, and thus an important subject of scientific studies, especially related to their bioluminescent behavior and biochemistry. Together with other luminous beetles, such as Rhagophthalmidae, Phengodida e, and some Elateridae. Fireflies pass Luciferase catalyzes luciferin for bioluminescence. The sequence, structure, and function of firefly luciferase have long been extensively studied, resulting in numerous molecular, biomedical, pharmaceutical, and bioanalytical applications.

However, the genetic basis and evolutionary features behind the firefly luciferase gene remain unclear to scientists, and little information about fireflies is available in public databases. Sequencing the firefly genome is needed to improve understanding and explore the mechanisms underlying the complex features of its life history. The PacBio SMRT and Oxford Nanopore sequencing platforms can generate high-quality genomes for fireflies. Integrating in-depth studies of multiple levels of data (including comparative genomics, proteomics, and transcriptomics of luminescent organs and their 3D reconstruction, in vitro experimental functional validation of genes, and CRISPR/Cas9 gene editing) can provide new perspectives on bioluminescence and light patterning for luciferin biosynthesis, origin and evolution.

The pathway of luciferin biosynthesis proposed based on multilevel data.

The pathway of luciferin biosynthesis proposed based on multilevel data. (Zhang et al., 2020)

Advantages of Long-read Genome Sequencing in Fireflies

Integrated Genome Assembly

Conventional short-read sequencing technologies often have difficulty dealing with repetitive genomic regions. For Aquatica Lateralis, whose genome complexity is similar to that of its close relatives Abscondita cerata and Lamprigera yunnana, such repetitive sequences are critical to understanding its unique biology. Long-read sequencing can span these problematic regions to produce a continuous and complete genome assembly.

Resolving Complex Regions

In addition to simple repeats, firefly genomes can contain complex structural variants that are critical to their bioluminescence and behavior. Long-read sequencing excels at mapping these regions, providing insights into the unique characteristics of fireflies, such as the origin of bioluminescence and its evolution.

Enhanced Annotation Capabilities

Given that long-read sequencing produces longer DNA fragments, it facilitates improved gene annotation, especially for those genes that may be segmented or lost in short-read assemblies. For organisms like fireflies, this is critical for a comprehensive understanding of their genetic functional landscapes, from bioluminescence to mating behavior.


Applications of Long-read Genome Sequencing in Fireflies

Evolutionary Insights

Long-read sequencing of Aquatica Lateralis, based on the draft genomes of species such as Abscondita cerata, can paint a holistic picture of firefly evolution. In turn, this could help researchers identify when specific traits (such as different light patterns or UV sensitivity in vision) appear in their evolutionary timeline.

Biotechnological Potential

The luciferase enzyme responsible for firefly luminescence is already widely used as a reporter gene in molecular biology and in biomedical imaging. A deeper understanding of the Aquatica Lateralis genome may reveal new proteins or pathways that can be used for biotechnological applications.

Conservation Research

As human activities reshape landscapes, understanding the genetic adaptations and resilience of species becomes critical. Lengthy genomic insights into Aquatica Lateralis could inform natural resource conservationists about the vulnerability of fireflies, contributing to their conservation in their natural habitat.


Read More:

merip seq

microbial whole genome sequencing

Reference

  1. Zhang, Ru, et al. "Genomic and experimental data provide new insights into luciferin biosynthesis and bioluminescence evolution in fireflies." Scientific reports. 10.1 (2020): 15882.

Gravatar
Pin on Pinterest
long-read-sequencing-for-population-scale-genomic-

Population genetics and precision health research rely on large genomic datasets. Long-read sequencing from Pacific Biosciences and Oxford Nanopore Technologies (ONT) has achieved a level of accuracy and throughput that allows for the progression from single genomes and small populations of individuals to the detection of variation in large-scale populations. Population-scale genomic studies are important, including reflecting the genetic diversity of target populations, detecting challenging genomic regions, serving as a resource for population genetics, translational research, and drug discovery, etc.

Long-read Sequencing for Population-scale Genomic Study

Overview of population-scale studies using long-read sequencing. (De Coster et al., 2021)

Overview

Sequencing the deoxyribonucleic acid (DNA) or messenger ribonucleic acid (mRNA) of different individuals in single or multispecies populations (known as population-scale sequencing) is fundamentally aimed at revealing allelic variation in macroscopic population profiles. This approach provides a critical scaffold for addressing multifaceted queries spanning the research fields of evolutionary biology, agronomic biotechnology, and translational medicine. Historical precedents of population-centric genomic studies, especially genome-wide association studies (GWAS), have always faced challenges in capturing the full range of genetic determinants of human phenotypic expression and pathological manifestations. This gap in understanding can largely be attributed to the intricate network of structural variation (SV). These SVs include inversions, deletions, and other complex chromosomal rearrangements that often remain elusive in the face of traditional sequencing methods.

High-throughput short-read sequencing platforms are characterized by read lengths that fluctuate between 25 base pairs (bp) and an upper limit of 400 bp. Their abilities are often hampered when they are tasked with deciphering variations hidden within the "dark matter" regions of the genome. Furthermore, they do not perform well in accurately resolving broad or complex variants. These obstacles not only compromise the integrity of genetic inferences derived from ancestry cohort datasets, but ultimately lead to a weakened, if not fragmented, understanding of the intricate interplay between genetic markers and disease etiology.

Emerging on this horizon is the promising field of long-read sequencing. This format enables the interrogation of genomic fragments spanning considerable contiguous lengths. The resulting capability is a holistic characterization of SVs across the human genomic landscape, setting the stage for an era dominated by population-scale long-read sequencing. By leveraging this cutting-edge technique, researchers are poised to unearth previously mysterious SVs with important links to phenotypic expression in humans, crops, fruit flies, and even birds such as songbirds. This paradigm shift is not just a technological advance, but marks a transformative leap in metagenomic research, heralding unprecedented insights and breakthroughs.

Project Strategies for Population-scale Sequencing

At the start of a population-scale sequencing project, there are multiple strategies with specific budget requirements to consider, as shown below. These strategies allow for different sizes and budgets, which can have an impact on the level of resolution at which genetic variants are detected.

Full Coverage Approach

This strategy is designed to sequence every sample from a population with moderate to high coverage, allowing for the highest level of resolution. The main criterion for determining the coverage required for each sample is whether it is assembled from scratch (requiring >40-fold coverage) or a reference-based comparison method (requiring >12-fold coverage42 ). The advantages of this strategy are its comprehensiveness, simplicity of study design, and relatively simple computational workflow. In addition, the samples are similarly covered and therefore equally well-studied, and rare variations in each sample can be easily detected.

Mixed Coverage Approach

In a "mixed-coverage" approach, a subset of samples representing subgroups (e.g., ethnicities or subgroups) of a cohort is sequenced at high coverage, and the remaining samples are sequenced at low coverage. Although this approach is generally less expensive than the full coverage approach, it still achieves higher overall detection sensitivity and is therefore particularly suitable for studies with a large number of individuals or a limited budget. However, some analytical challenges remain, especially in achieving high accuracy of genotypes across multiple samples or in distinguishing somatic versus heterozygous germline variants, which is further complicated by regions exhibiting recurrent mutations. In addition, this hybrid coverage approach will certainly bias against common alleles, as many rare alleles may be missed, especially when a locus is heterozygous and alternative alleles are therefore sparsely covered.

Hybrid Sequencing Methods

This approach involves sequencing only a small number of samples (e.g., 10-20% of all samples) with long reads, sequencing the remaining samples with short reads, and genotyping the variants found in the long reads. Once a subset of samples has been sequenced using the long read technique to produce a set of identified SVs, they can be genotyped for their breakpoint coordinates in the short read long sequence dataset. In this way, robust allele frequencies for the identified variants can be obtained. This strategy has been applied to diversity panels of human SVs to discover new expression quantitative trait loci (eQTL) and evolutionarily adapted traits.

Long-read Sequencing for Population-scale Genomic Study

Overview of long-read population study design. (De Coster et al., 2021)

The Importance of Long-Read Sequencing Technology in Population-Scale Study

One of the inherent challenges of population genetics is the accurate phasing of haplotypes-determining specific combinations of alleles located on a single chromosome. Long-read sequencing provides an effective solution by capturing longer DNA fragments, which can directly determine haplotype structure without relying on computational prediction or family-based studies. This capability is transformative for population-scale studies, where understanding the distribution and combination of specific allele sets can help decipher population history, migration patterns, and shared inheritance patterns.

Structural variants, such as deletions, duplications, and inversions, can have profound effects on gene function and expression. Capturing these variants at high resolution is critical when studying large populations. Long-read sequencing can identify structural variants that may be overlooked or inaccurately represented by short-read methods.

Population-scale Sequencing Downstream Analysis Methods

The choice of analytical tools is critical for downstream analysis at the population scale. Prior to downstream analysis, quality control must be performed on experimental factors that directly affect the performance of assembly, SV detection, and read-sequencing phases. There are several strategies for population-scale downstream analysis:

Read Alignment-based Analysis

Comparison-based methods are often the preferred approach for population-scale studies because they facilitate the comparison of all samples to a common coordinate system (i.e., the reference genome). In addition, these methods are usually less computationally demanding and require much less coverage than compilation-based methods. Comparison-based methods rely on matching sequencing reads to a reference genome, the overall correctness of which will affect the analysis of the read data.

Software for analyzing long-read sequence data, such as NGMLR and LAST methods, speeds up the matching process and improves the accuracy of long-read matching. In addition, a variety of tools for detecting genetic variation can eliminate the need for high sequencing coverage by enabling SV calling and genotyping at lower coverage.

Population-scale De Novo Assemblies

Traditional reference genomes, often based on short-read sequencing, can be fragmented and may miss key sequences. Such omissions may lead to significant differences, including false-positive or false-negative variant identifications. Therefore, there is an urgent need to construct and compare scratch assemblies.

The increased availability and affordability of long-read sequencing data have led to an explosion of faster and more accurate genome assembly toolsDe novo assembly-based methods are often more sensitive and better suited to reconstructing highly diverse regions of the genome than comparison-based methods. The increasing yield of long-read sequencing technologies will allow sufficient coverage of each sample to be sequenced for high-quality de novo assembly.

Graph Genome Methods

Both read matching and de novo assembly methods can have systematic problems with complex structural variants, missing insertion sequences in the reference genome, repetitive variants, and highly polymorphic loci. A major benefit of graph genomes is the use of short reads for genotyping SVs. In addition, with this graph-based approach, for population studies, the often discussed dichotomy of using an existing reference genome for alignment or constructing a new reference genome by assembling it from scratch can be avoided since downstream of this step all sequences have to be aligned with the backbone of the individual (reference) assembly or pan-genome map for identification of variants, annotation, and statistical evaluation.

Learn more:

circular rna sequencing

ribosome footprinting

References

  1. De Coster, Wouter, Matthias H. Weissensteiner, and Fritz J. Sedlazeck. "Towards population-scale long-read sequencing." Nature Reviews Genetics 22.9 (2021): 572-587.
  2. Rech, Gabriel E., et al. "Population-scale long-read sequencing uncovers transposable elements associated with gene expression variation and adaptive signatures in Drosophila." Nature Communications 13.1 (2022): 1948.